
How to Look Up Clark County Jail Population Data
The main source for Clark County jail population data is the Clark County Jail Services annual reports page. Each report covers staffing levels, jail statistics, and news on custody operations for a given year. The reports are in PDF format and are published on the county's official site. They are the closest thing to a comprehensive public data release that Clark County Jail Services makes available. Anyone wanting to look up Clark County inmate population figures, booking trends, or classification breakdowns should start here.
Beyond annual reports, two federal sources fill in state and national context. The Bureau of Justice Statistics publishes the Jail Inmates series, which tracks jail populations across the country each year. These reports give per-100,000 rates at the national level and break out state-by-state data in supplemental tables. The Vera Institute of Justice maintains its Incarceration Trends database, which covers county-level jail data going back decades for many jurisdictions. Where Clark County-specific numbers do not appear in the official reports, those sources supply the broader frame. Note that BJS and Vera data carry their own reporting lags and should always be compared to the county's own annual reports for accuracy.
The Washington Association of Sheriffs and Police Chiefs (WASPC) also collects statewide jail statistics through its annual jail report. That report covers jail capacity, admissions, and average daily population by county. It is a secondary source for statewide comparisons and helps place Clark County numbers in a Washington-specific context.
The screenshot below, from the Clark County Jail Services annual reports page, shows where published reports are posted and what topics each year covers.
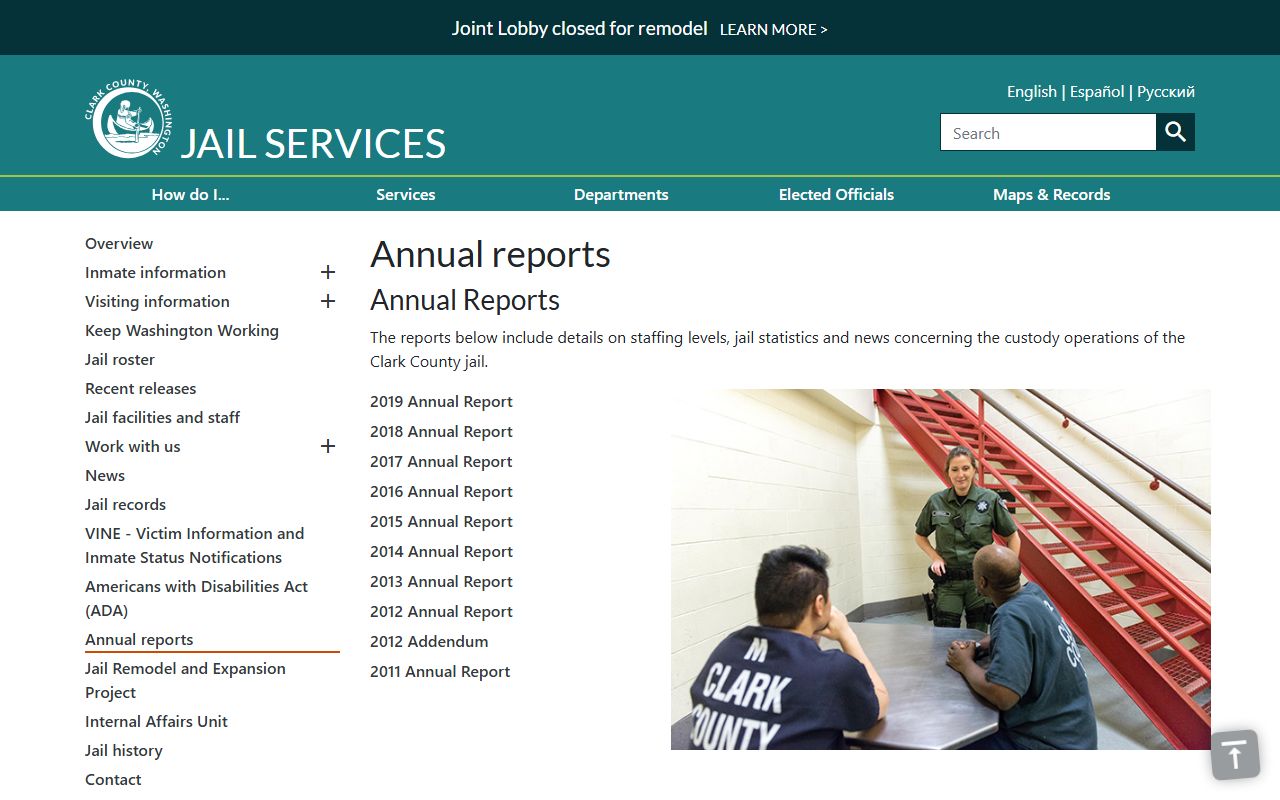
The annual reports section lists recent years and links to PDF documents with jail statistics, staffing levels, and custody operations news for Clark County.
Clark County Jail Capacity Overview
Clark County currently has one inmate housing facility. The Main Jail sits inside the Clark County Law Enforcement Center in downtown Vancouver, next to the Courthouse and across the street from the Public Service Center. There is no second jail, work center, or satellite facility in current operation. All booking, housing, and release processing for Clark County jail inmates takes place at this single location.
| Facility | Location | Rated Capacity |
|---|---|---|
| Main Jail (Clark County Law Enforcement Center) | Downtown Vancouver, WA | Not published in official sources |
The official Clark County Jail Services pages do not publish a rated bed capacity figure in the text that was available for this research. The annual reports are the intended channel for that data, and a current capacity number should be confirmed directly through those PDFs or by contacting Jail Services. This is an honest gap in publicly available summary text, not a data error. The 2018 CFAC jail data package referenced in public records did include capacity-related figures, but those are dated and should not be treated as current.
Note: Contact Jail Services at 564-397-4996 or review the most recent annual report at clark.wa.gov/jail-services/annual-reports for a current bed count.
Jail Staff and Operational Units
Jail Services is led by a Director and two Deputy Directors, one for Jail Administration and one for Jail Operations. Five Commanders are assigned to operational units. The official Clark County Jail Facilities and Staff page lists the full leadership structure and staff breakdown by unit.
The screenshot below, from the Clark County Jail facilities and staff page, documents the staffing structure that supports the Main Jail.
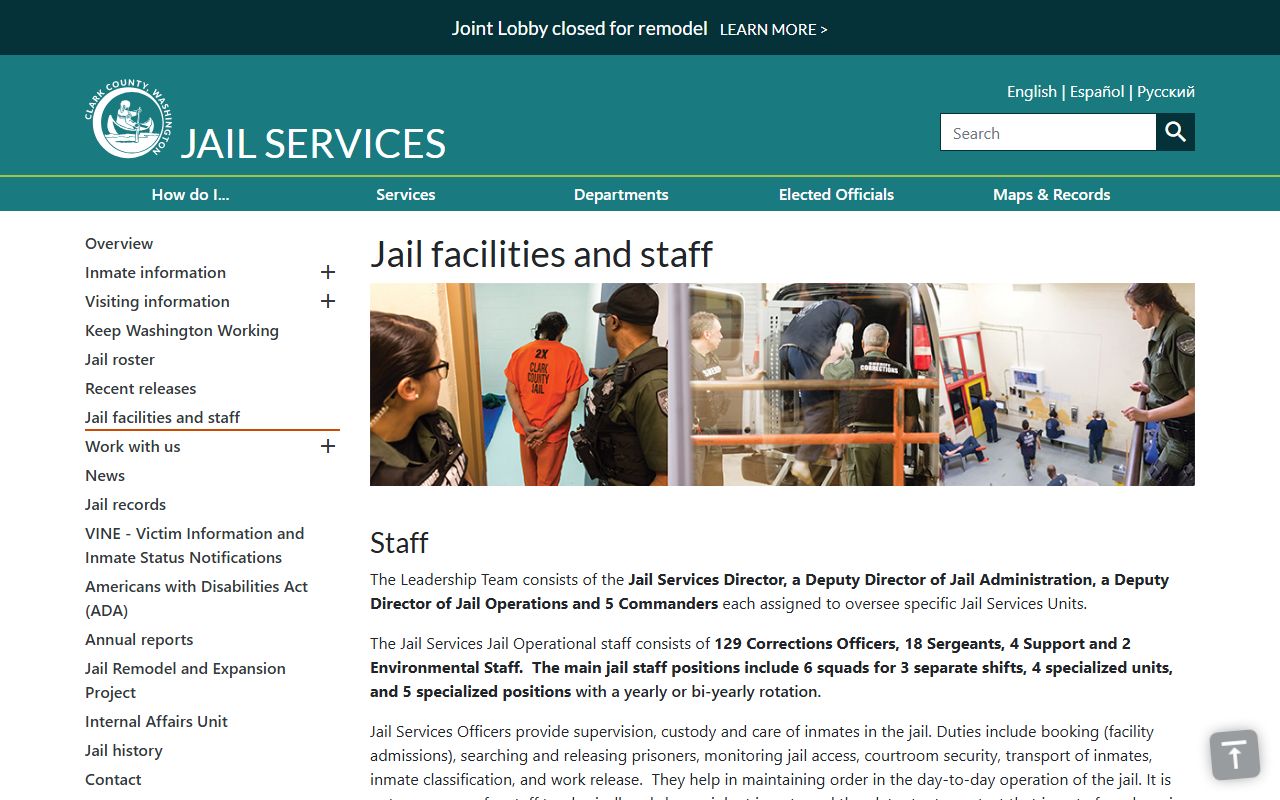
The page lists each operational unit, the number of personnel in each, and the functions they carry out inside the facility.
The table below summarizes the staff structure as published by Clark County Jail Services.
| Unit / Role | Staff Count | Function |
|---|---|---|
| Corrections Officers | 129 | Direct custody and housing supervision |
| Sergeants | 18 | First-line supervisors over corrections officers |
| Support Staff (non-supervisory) | 4 | Facility support roles |
| Environmental Staff | 2 | Facility maintenance and environment |
| Support Supervisors | 2 | Supervision of Records/Reception/Finance units |
| Jail Records, Reception, Public Disclosure, ID, Finance | 14 | Administrative and records functions |
| Jail Industries Manager | 1 | Oversees all industries programs |
| Jail Industries Supervisors | 2 | Day-to-day industries oversight |
| Jail Industries Staff (Food, Laundry, Maintenance, Logistics, Property) | 15 | Operations across five service areas |
Jail Industries runs five service areas: Food Services, Laundry Services, Day Maintenance, Logistics, and Property. These units handle daily operations inside the facility and rely on a mix of civilian staff and, in some cases, inmate work assignments. The breakdown shows a facility with a substantial support structure behind the 129 sworn corrections officers. For a communications or disability concern, Jail Services lists correctionsecc@clark.wa.gov. The 24-hour safety and communication line is 564-397-2207.
Average Daily Population
Average daily population, or ADP, is the standard measure used to describe jail load over time. It is calculated by dividing the total number of inmate-days in a period by the number of days in that period. A jail running at or near capacity will have an ADP close to its rated bed count. A jail with seasonal swings or booking surges will show ADP variance across months.
Clark County Jail Services does not publish a current ADP figure in summary form on the public website. The annual reports are the stated source for jail statistics including ADP. A 2018 CFAC data package that appeared in official search results did include an average daily population figure for that year covering both the Main Jail and the former Jail Work Center. That figure is not reproduced here because it is dated and a current number is not available from official text. The most recent annual report PDF at clark.wa.gov/jail-services/annual-reports is the correct source for current ADP data.
At the state level, the Washington Association of Sheriffs and Police Chiefs collects ADP data county by county as part of its statewide jail report. That data allows a comparison of Clark County's average daily count to other counties in Washington. Vera Institute's Incarceration Trends database also contains historical ADP estimates by county going back to 1970 for most jurisdictions, which can show long-run patterns even when the county's own recent reports are not immediately available online.
Demographic and Classification Data
Clark County Jail Services annual reports include demographic breakdowns of the inmate population. The 2018 CFAC data package that appeared in official materials referenced demographics, homeless population counts, and classification levels as part of its reported data set. Those categories are standard across jail systems and are expected to appear in annual reports for more recent years.
Typical demographic fields covered in local jail annual reports include:
- Gender distribution (male and female counts or percentages)
- Age groupings (juvenile if held, young adult, middle adult, older adult)
- Race and ethnicity breakdown
- Homeless or housing-insecure population share
- Classification level (minimum, medium, maximum or equivalent local scale)
Because current 2025 demographic figures were not extracted from the annual report PDFs during research, specific percentages are not listed here. The annual reports at clark.wa.gov/jail-services/annual-reports are the right place to find verified, current numbers. Nationally, BJS data from the 2022 Jail Inmates report showed that roughly 85 percent of local jail inmates were male. That figure serves as a national baseline, not a Clark County-specific stat.
Classification at Clark County Jail determines housing assignment and programming eligibility. Inmates are assessed on arrival and can be reclassified as their case status changes. The classification system is not publicly detailed on the county website, but annual reports sometimes include a snapshot of how many inmates fell into each risk tier on a given date.
Pretrial vs Sentenced Population
Jail populations are generally split into two groups: people who have not yet been sentenced and are waiting for a court outcome, and people who are serving a sentence handed down by a judge. The pretrial group is often the larger share in local jails. A 2018 CFAC data package for Clark County included a pretrial versus sentenced snapshot, which confirms the county tracks this split. Current figures are in the annual reports.
Nationally, the Bureau of Justice Statistics reported that about 69 percent of the local jail population was held in a pretrial status as of the most recent Jail Inmates census. That means roughly two out of three people in a local jail on a given day have not been convicted of the charge they are held on. They are either awaiting trial, waiting for arraignment, or unable to post bail. The local Clark County figure may differ from the national rate depending on bail practices, court scheduling, and the mix of case types filed in Superior and District Court.
| Status | Clark County (Current) | National Baseline (BJS 2022) |
|---|---|---|
| Pretrial (unconvicted) | See annual report | Approx. 69% |
| Sentenced (convicted) | See annual report | Approx. 31% |
The table above shows the national split as a reference point. Clark County-specific figures appear in the annual reports. Pretrial detention length varies by charge type and bail amount. Under Washington law, a person held on a no-bail charge stays in custody until the court resolves that condition. People who can post bail may be released before trial. The length of time spent in pretrial status directly affects the ADP figure and is a key driver of total jail population size.
Misdemeanor vs Felony Population
Clark County Jail holds people charged with both misdemeanors and felonies. Felony cases go through Superior Court. Misdemeanor cases, including gross misdemeanors, go through District Court or the Camas-Washougal Municipal Court. Both types of charges can result in pretrial detention and, after conviction, short-term sentences served at the county jail rather than a state prison.
The 2018 CFAC data package for Clark County included a felony versus misdemeanor snapshot, so the county does track this split. Current figures are in the Jail Services annual reports. At the national level, felony charges make up the larger share of local jail populations, but misdemeanor bookings often account for a high volume of short-stay admissions that drive intake and release counts even if they represent fewer bed-days. Understanding both the stock count and the flow count matters when reading a jail population report.
Users looking for individual case charge information for a specific person should check the Clark County inmate records page. The public roster lists current charges by name. For case history and court outcomes, see the Clark County arrest records page and the Washington Courts Odyssey Portal.
Mental Health and Medical Population
Local jails across the country have become significant holders of people with mental illness. The Bureau of Justice Statistics has reported that a substantial share of jail inmates have a history of mental health problems, with some estimates placing it above 40 percent. Vera Institute research has documented the same pattern. Clark County is not exempt from this trend. The 2018 CFAC data package for the county specifically referenced a mentally ill population figure as part of its data set, and the county's therapeutic court programs show that mental health is a recognized factor in local justice work.
Clark County Superior Court runs a Mental Health Docket, which meets on Wednesdays, as an alternative to traditional prosecution for qualifying individuals. That program takes some people out of the jail population and into a supervised treatment track. But many people with mental illness still move through the main booking and housing process, and annual reports may break out the mental health count separately from the general population.
Medical services inside the Main Jail cover routine care, medications, and crisis response. The 2018 CFAC data package included medical transport counts, detoxification data, and a waiting list figure for mental health services, which suggests the demand for mental health care at the facility exceeded immediate capacity in that period. Whether that gap has narrowed or widened depends on resources added since then. Specific current figures appear in the annual reports. For questions about ADA or disability accommodations at the jail, the county lists correctionsecc@clark.wa.gov as the contact address.
Note: Mental health data from annual reports reflects the reporting period and may not match the current daily count.
National and State Context
The Bureau of Justice Statistics publishes the Jail Inmates report series annually, most recently drawing on data from the Annual Survey of Jails. The national jail incarceration rate was approximately 217 per 100,000 U.S. residents as of the 2022 report, down from a peak of around 258 per 100,000 in 2008. That decline reflects a broad trend across many counties, driven by bail reform, reduced bookings during the COVID-19 period, and policy shifts in some jurisdictions. Washington state has generally run below the national jail rate, reflecting its relatively urban population mix, diversion programs, and pretrial services infrastructure.
Rate Comparison (Context Only)
The table below uses state and national figures from BJS and WASPC. Clark County-specific per-100,000 figures are not published in summary form and must be calculated from the annual report ADP and current county population data.
| Level | Jail Population per 100,000 | Source |
|---|---|---|
| Clark County, WA | See annual report (not in summary text) | Clark County Jail Services annual reports |
| Washington State | Below national average (exact varies by year) | WASPC annual jail report |
| National | Approx. 217 per 100,000 (2022 BJS data) | Bureau of Justice Statistics, Jail Inmates 2022 |
The Vera Institute of Justice maintains the Incarceration Trends tool at the county level. It allows a side-by-side look at Clark County's historical jail population against neighboring counties and state peers. Vera's data shows that many mid-size counties in the Pacific Northwest have seen jail populations rise and fall with regional economic cycles, law enforcement staffing levels, and court scheduling changes. Clark County's position in the lower-left corner of Washington, sharing a metro area with Portland, Oregon, gives it an urban character that tends to correlate with somewhat lower rural-county incarceration rates but with more complex case mixes.
For a Clark County-specific rate, divide the annual report ADP by the county's current population (roughly 530,000 as of recent estimates) and multiply by 100,000. That calculation gives a county-specific figure that can be placed next to state and national numbers for a meaningful comparison.
Population Trends Over Time
The Clark County annual reports page is the official starting point for a multi-year trend analysis. Each year's report covers bookings, releases, ADP, classification, demographics, staffing, and budget. Reading three to five consecutive reports gives a picture of whether the population is growing, flat, or declining, and what is driving the change. The 2018 CFAC data package showed that the county was tracking monthly intakes and releases, which means that level of detail exists in official records even if it is not summarized in public-facing text.
Nationally, jail populations fell sharply during the COVID-19 period of 2020 and 2021 as courts slowed and some jurisdictions reduced bookings. Many counties saw partial rebounds in 2022 and 2023 as court calendars reopened and backlogs cleared. Whether Clark County followed that national pattern is something the annual reports would confirm. Pretrial population share tends to rise when courts run behind schedule, because people who would otherwise resolve their cases quickly stay in custody longer.
- Annual reports available at clark.wa.gov/jail-services/annual-reports
- BJS Jail Inmates series available at the Bureau of Justice Statistics website for national trend data
- Vera Incarceration Trends tool covers Clark County historical ADP by year
- WASPC jail reports cover Washington state county comparisons year by year
- Clark County population growth (roughly 2-3 percent per year in recent periods) affects the per-capita rate even when raw counts stay flat
Trends matter for planning. A jail that is consistently at or above capacity faces pressure to add beds, reduce bookings, or expand diversion programs. A jail with declining population may have surplus capacity that affects budget decisions. Neither the county site nor this summary publishes a trend chart. The annual reports are where that data lives.
Searching for Clark County Inmate Records by Name
Population data covers the jail as a whole, not individual inmates. Name-based searches of who is currently in custody go through the Clark County inmate records page, which covers the public jail roster, booking details visible on that roster, and the 24-hour information line at 564-397-4996.
Where the Data Comes From
Clark County Jail population data has three main tiers. The first is official county data from Jail Services, primarily the annual reports and the public jail roster. The annual reports are the most detailed and include staffing, statistics, and custody operations information. The roster is the live, real-time record of who is in custody. Both come from clark.wa.gov/jail-services.
The second tier is state-level data from WASPC. The Washington Association of Sheriffs and Police Chiefs collects and publishes a statewide jail report that compiles data submitted by county jails across Washington. That report allows county-to-county comparison and gives Clark County's figures a regional frame. WASPC data may lag the county's own reports by six to twelve months depending on submission and publication schedules.
The third tier is federal data from the Bureau of Justice Statistics and the Vera Institute. BJS publishes Jail Inmates each year using its Annual Survey of Jails, which samples a large portion of U.S. jails and extrapolates national totals. The survey is widely cited in policy research and journalism. The Vera Institute builds on BJS data and adds county-level historical records going back decades, making it useful for trend research. Neither BJS nor Vera is a primary source for Clark County-specific numbers; they provide context, comparison, and historical depth. For individual record lookups, the Clark County released inmates page and the Clark County arrest records page cover related topics. General questions about public records from the jail can be directed to the Clark County court records FAQ.